Petrol is a product that used by most of Australians. So people are pretty sensitive to price changes, especially when the fuel become more expensive. With prices reaching $1.6 for unleaded the debates are becoming more and more hot.
Are greedy petrol traders ripping off Australians or the price changes are fair and primarily defined by the factors such as FX rate and crude oil price? Official point of view from ACCC is the prices are mostly determined by international factors.
Let’s check, is it true or not using R and some simple data analysis and visualization techniques. We’ll check how retail petrol price correlate with two major international factors that affects it – crude oil price and Australian dollar exchange rate.
Get the data
First we need to collect the data. We need the next pieces of data:
- Crude oil price. It is usually calculated in USD for barrel
- AUD to USD foreign exchange rate
- Retail petrol prices in Australia
I was able quite quickly get first 2 pieces of data, they are available at FRED up to 1980th in easy to use CSV format. I’ve just had to add couple final rows with the most recent data, did it manually.
Getting Aussie retail petrol prices were much harder. There is plenty of data available of current prices, but getting monthly historical data appeared to be a challenge to my surprise. The best I was able to get is the data from Western Australia government agency starting from early 2000th. Taking into account that WA displays the shortest petrol price circle it is probably good enough.
After a bit of data wrangling I was have produced the data frame with next columns:
- Date (month and year)
- Crude oil price in AUD per barrel
- Petrol price in AUD per litre
Having oil price in AUD is important to account for FX rate fluctuation. You can get full csv file from my Github.
Let’s start making charts. I’ve used R package ggplot2 for this job.
Crude oil price
The piece of code below produce a chart of monthly crude oil price in Australian dollars since 2001.
df1 %>% ggplot(aes(date, oilaud)) +

geom_line()+

xlab("Date")+ylab ("Price per barrel, $AUD")+

ggtitle("Crude oil price")+

theme_economist()
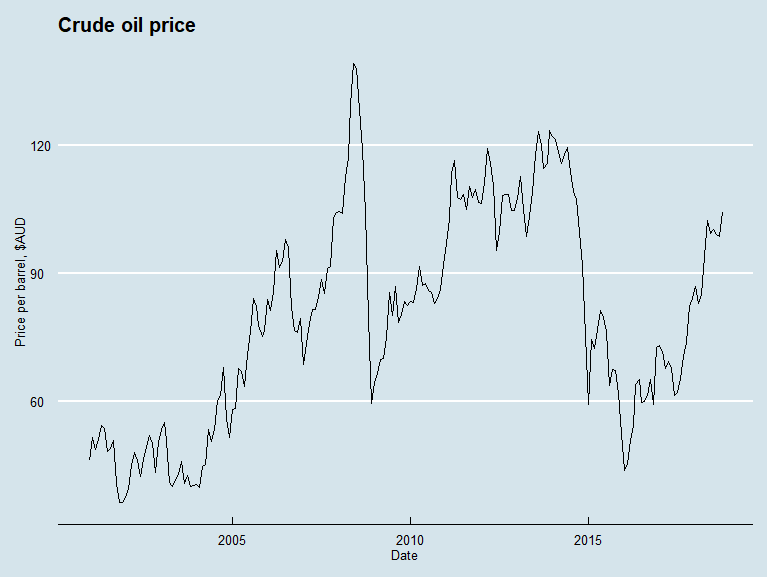
dplyr package is used to allow pipes (%>% syntax).
Petrol retail prices
Next let’s create retail petrol prices, the approach is very similar.
The code:
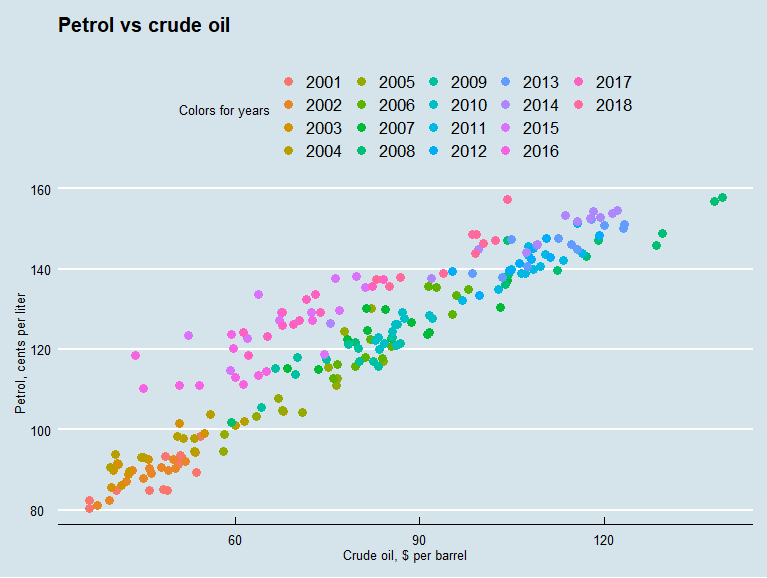
df1 %>% ggplot(aes(oilaud, petrol_price, color=factor(year(date)))) +

geom_point(size=3)+

xlab("Crude oil, $ per barrel")+ylab ("Petrol, cents per liter")+

ggtitle("Petrol vs crude oil")+

theme_economist()
and the chart:
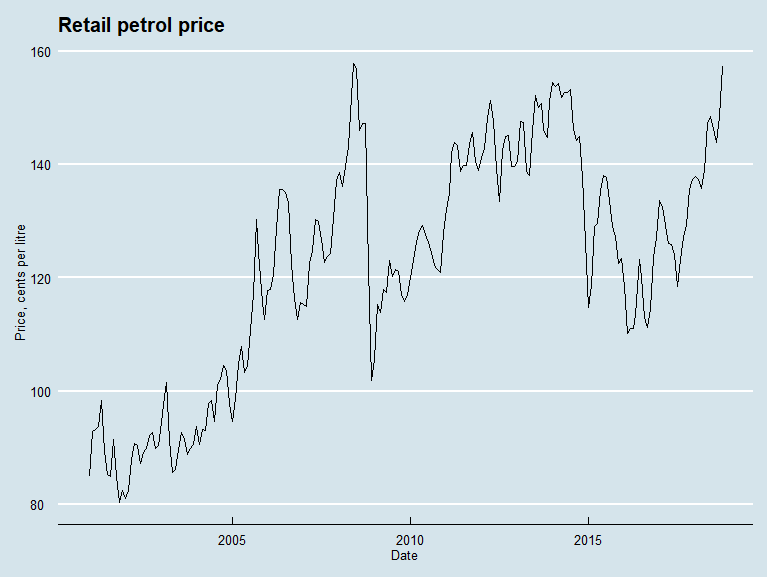
The charts looks quite similar isn’t it?
Let’s put them together.
Crude oil with petrol
ggplot2 allows quite easily to put 2 variables into one chart. Here is the code to do it:
df1 %>% ggplot(aes(date))+

geom_line(aes(y=oilaud, colour= "Oil"))+

geom_line(aes(y=petrol_price, colour="Petrol"))+

scale_y_log10()+

xlab("Date")+ylab ("Prices")+

ggtitle("Retail petrol price vs crude oil price")+

theme_economist()
Because we have retail prices in cents per litre and oil prices in dollars per barrel the numbers are quite similar and we don’t really need to make more complex things like changing scales, which we have to do for vastly different values.
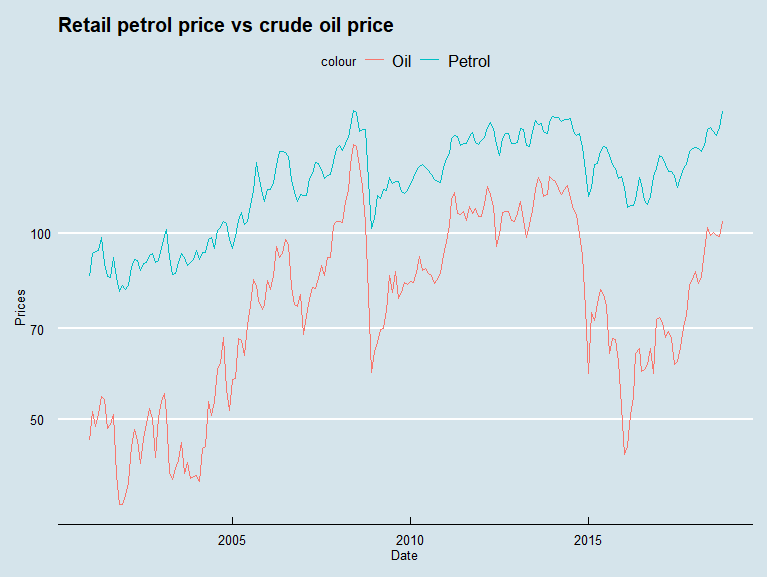
Looks like the prices correlate, isn’t it?
Let’s make another visualization, scatterplot.
The code:
df1 %>% ggplot(aes(oilaud, petrol_price, color=factor(year(date)))) +

geom_point(size=3)+

labs(title = "Petrol vs crude oil\n", x = "Crude oil, $ per barrel", y = "Petrol, cents per liter", color = "Colors for years\n")+

theme_economist()
We use here colours to represent years of the data and a bit different approach to make titles and legend.
Visually it seems that the correlation between crude oil price and retail petrol price is quite strong indeed.
Let’s calculate the correlation with R function
cor(df1$petrol_price, df1$oilaud)
The value returned is 0.9256118 which is a very strong correlation.
So it seems that overall petrol vendors are just passing the factors beyond their control (global oil price and FX rate) and there is nothing to worry about, all good. Or not?
Have a closer look
Probably you have noticed that while overall the dots on the scatter plot form the line, some of them well above it. And many of such dots are in the colours of recent years (2014-2018). What does it mean?
If the dots are above a trend line (imaginary in our case) they are out of general pattern, in our case the retail price is above the level we would expect with perfect correlation.
You may also notice that the crude oil price now is quite far from the highest point it, while current retail price is very close to historical maximum level.
The code below filter out subset of data when crude oil price was above AU$100
over100 <- df1 %>% filter(oilaud >100)

over100 %>% ggplot(aes(oilaud, petrol_price, color=factor(year(date)))) +

geom_point(size=3)+

labs(title = "Petrol retail in Australia vs crude oil, when crude oil over AU$100\n", x = "Crude oil, $ per barrel", y = "Petrol, cents per liter", color = "Colors for years\n")+

geom_hline(yintercept = 157.3)+

geom_vline(xintercept = 104.29)+

theme_economist()
It produces the next scatter plot:
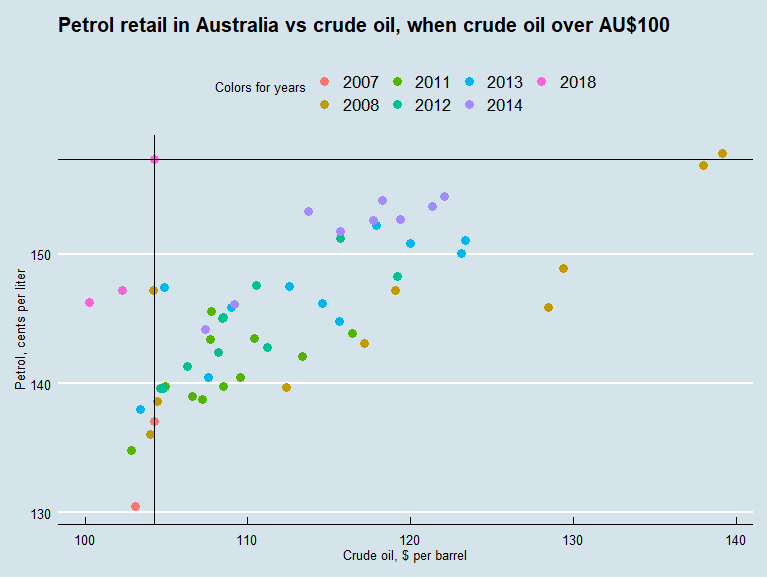
Vertical and horizontal black line intercepts on the most recent price point (begin of Oct 2018).
It is clear that:
- Current price is historically the second most expensive
- In the past with the same crude oil price retail price was much lower – very often below $1.40 and always below $1.5
- Similar retail price existed when crude oil price was close to $140 per barrel, over 20% more expensive than now
So it looks like at the moment Australian consumers are being ripped off. But based on the history it shouldn’t last too long, so hopefully the prices soon return to more fair level.
All code and data available on Github
Great post. You might be interested in a similar post I did a few years ago https://mcfromnz.wordpress.com/2012/07/28/petrol-prices-adjusted-for-inflation/ I recently updated the graph (not posted yet) and it hadn’t changed all that much.